UPDATED August 2013
Download Fact Sheet as a PDF - UPDATED August 2013
As part of the new Annual Professional Performance Review (APPR) process, New York State has produced growth scores for grade 4-8 ELA and math teachers and their principals. These growth scores were sent to districts in August 2012 and are expected to be available to individual teachers through a password-protected website by the end of 2012.
Districts and educators had an opportunity to verify the data submitted by their school between April and July 2012. Teachers were asked to verify roster data.
If you’re not a grade 4-8 ELA or math teacher, you will develop student learning objectives, or SLOs, to measure growth.
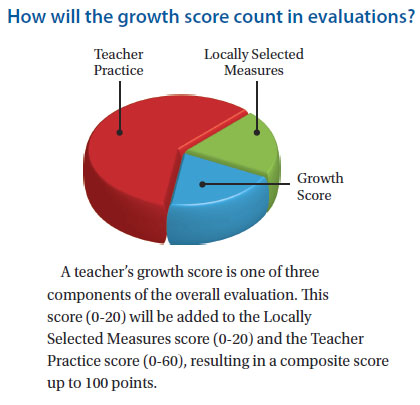
State Growth Scores: Where do they come from?
Each student in grades 4-8 will receive Student Growth Percentiles (SGP) scores based on their own academic growth on ELA and Math state assessments, from one year to the next, as compared to similar students. To do this, each student is compared to students who performed the same as they did on the previous year’s assessment. For example, Student A scored a 450 on last year’s grade 5 ELA assessment. To measure student A’s growth in grade 6, his sixth grade score will be ranked with all other students who received a 450 on the grade 5 ELA exam last year.
The model also takes into account poverty, students with disabilities (SWD) and English language learners (ELL) in looking at similar students. For example, if Student A was an English language learner, he or she would be compared to all other students who scored a 450 on last year’s grade 5 ELA and were also ELL students. SGPs range from 1-99, and they tell you where a student stands in a distribution of similar students. If Student A’s SGP was 48, it means that his or her performance on the grade 6 ELA assessment was the same or better than 48 percent of similar students taking the assessment.
Mean Growth Percentile (MGP)
Each teacher of grades 4-8 ELA and math will receive an MGP score which is the average of all SGPs in a teacher’s classroom. MGP’s are based only on students who had test scores from the current and prior school year and who met the state’s enrollment standards in the reported school year.
The MGP for each grade or subject is calculated using the SGP of each student meeting the minimum enrollment of 60% of the course duration and weighting each SGP by the proportion of course time the student was enrolled with the educator and the proportion of time the student was in attendance. Also, to assure the statistical calculations have a high degree of accuracy, an MGP is only reported if it is made up of at least 16 SGPs. This can be made up of a combination of subject and grade SGPs reflecting the students the teacher is responsible for.
Once the secure online reporting system is available for educators to access, here’s what an individual teacher report will look like:
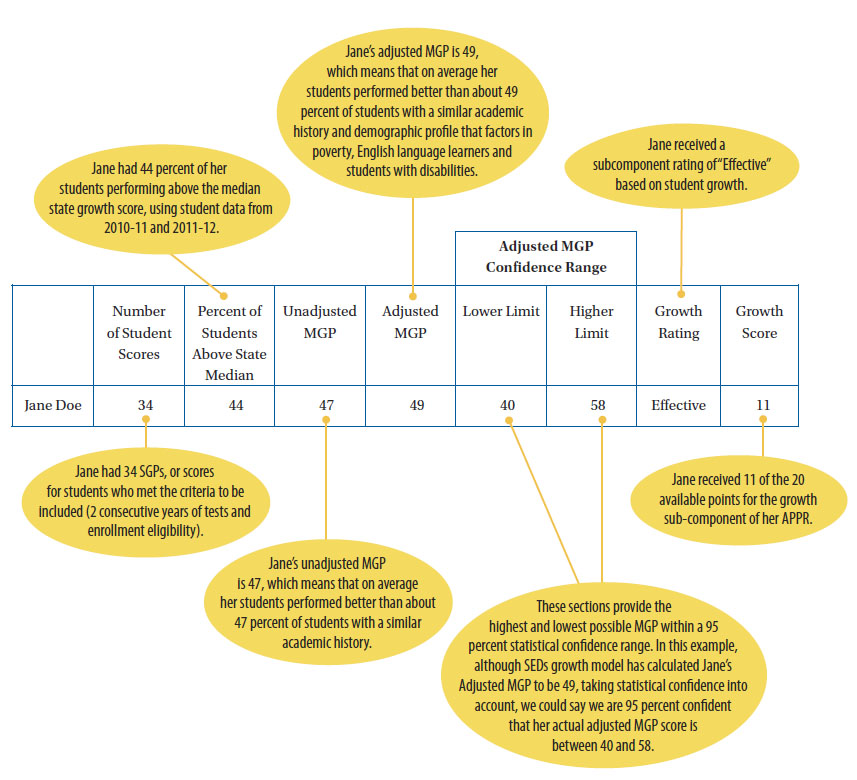
If you have any questions about the data in the report, these questions should be raised with the school administration in conjunction with your local union president.
Source: Adapted from information contained in SED’s “A Teacher’s Guide to Interpreting Your New York State-Provided Growth Score.” More information is available at www.nysut.org/research. SED’s complete package of information is available at http://engageny.org/resource/interpreting-and-using-your-nys-provided-2011-12-growth-score-reports/. If you have any questions on this document contact Heather Adams at hadams@nysutmail.org.