Overview
As required by law, each year prior to the school budget vote all districts must submit a Property Tax Report Card to the New York State Education Department (SED). The data contained in the 2016 Property Tax Report Card compares the 2015-16 school budget with the 2016-17 proposed school budget and the 2015-16 tax levy with the 2016-17 projected tax levy.
In total, 669 school districts have submitted their 2016 Property Tax Report Card. The Big Five City school districts are not covered by this requirement as the residents in these districts do not vote on their school budget. In addition to the spending and tax levy increases, districts are also required to report three parts of the fund balance on the Property Tax Report Card: (1) the amount and percent of the unrestricted fund balance, (2) the restricted fund balance and (3) the appropriated fund balance. Although the unrestricted fund balance is limited by law to no more than 4%, 138 school districts reported that they estimate that they will have a fund balance over that legal limit for 2016-17. In addition, 290 school districts reported that they will be right at that 4% limit for 2016-17.
School districts also reported information associated with the calculation of their property tax levy cap. According to the data, 88 school districts have a calculated allowable tax levy increase that is negative, meaning that these districts are restricted to raising less funds locally than the year before unless they seek an override. Statewide, there are 36 school districts that are proposing a 2016-17 property tax levy that exceeds their maximum tax levy limit, meaning these districts must get at least 60 percent voter approval for their budget to be adopted. (1)
The compilation of this information is available on the SED’s website at http://www.p12.nysed.gov/mgtserv/propertytax/#Data/
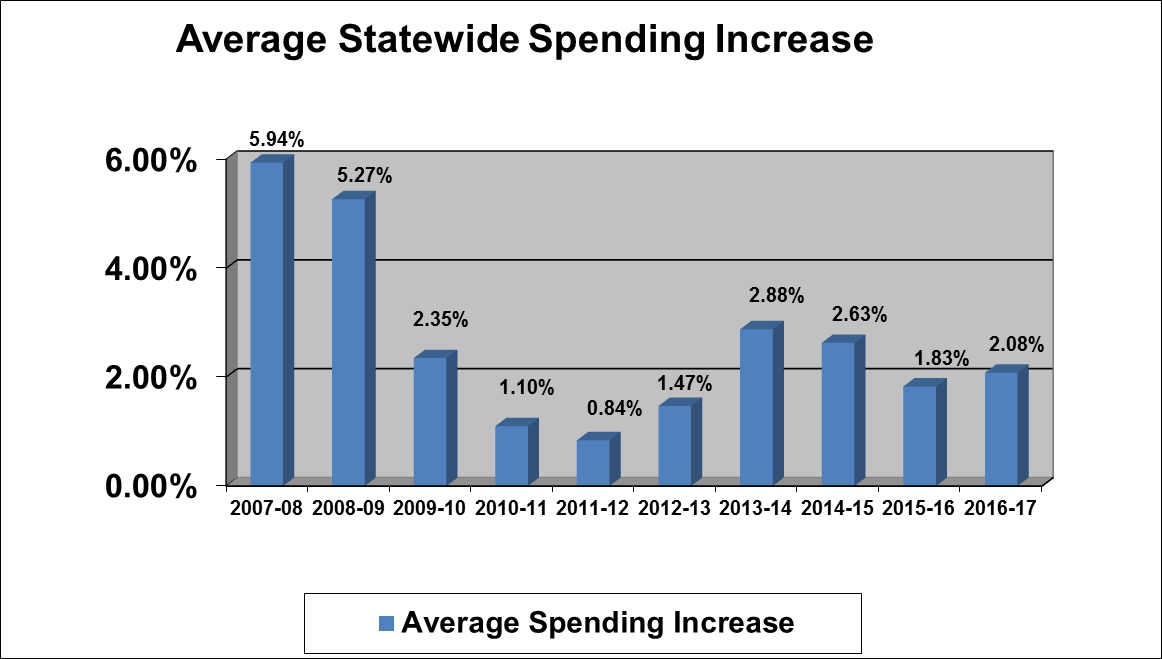
Spending
According to the data contained in the 669 Property Tax Report Cards, school districts on average are proposing budgets for 2016-17 that contain a spending increase of 2.08 percent. Last year the average statewide spending increase that districts presented in their 2015-16 school budgets was 1.83 percent. Voters will cast ballots on 2016-17 school budgets on May 17th.
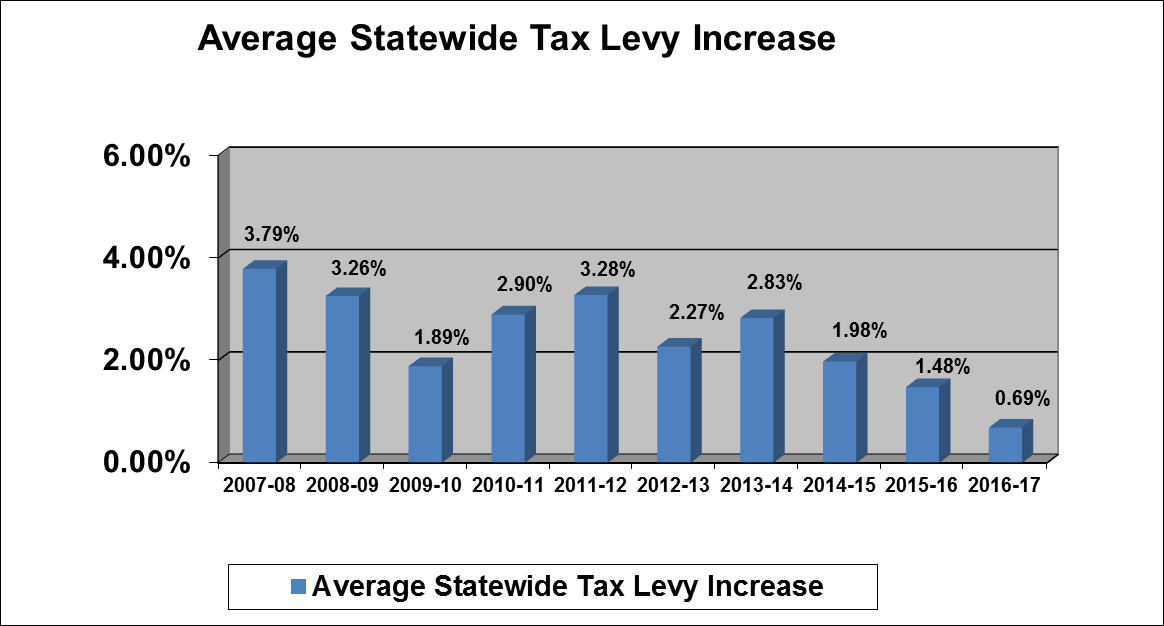
Taxes
The Property Tax Report Cards also reveal that the average tax levy increase contained in the proposed 2016-17 school budgets is 0.69 percent. Last year the average statewide tax levy increase was 1.48 percent.
(1) The 36 districts are: Amagansett, Bedford, Bradford, Bridgehampton, Brookfield, Canaseraga, Canisteo-Greenwood, Central Valley, Charlotte Valley, Copenhagen, Delhi, East Quogue, Elwood, Florida, Fort Edward, Franklin, Gloversville, Greenport, Hancock, Harborfields, Highland, Islip, Jasper-Troupsburg, Mechanicville, New Paltz, Northeast, Northville, Parishville-Hopkinton, Pulaski, Seneca Falls, Shelter Island, South Kortright, Tuckahoe Common, Tuxedo, Victor, and Waverly.